
Page 75 - วารสารการแพทย์แผนไทย ปีที่ 21 ฉบับที่ 2
P. 75
J Thai Trad Alt Med Vol. 21 No. 2 May-Aug 2023 291
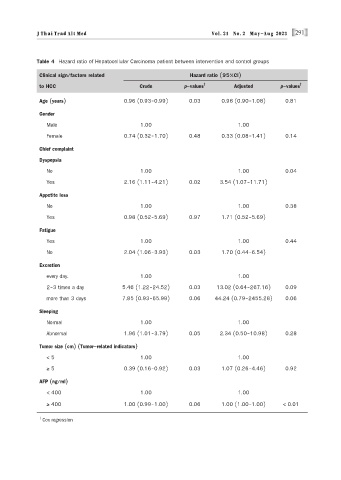
Table 4 Hazard ratio of Hepatocellular Carcinoma patient between intervention and control groups
Clinical sign/factors related Hazard ratio (95%CI)
†
to HCC Crude p-values Adjusted p-values †
Age (years) 0.96 (0.93-0.99) 0.03 0.98 (0.90-1.08) 0.81
Gender
Male 1.00 1.00
Female 0.74 (0.32-1.70) 0.48 0.33 (0.08-1.41) 0.14
Chief complaint
Dyspepsia
No 1.00 1.00 0.04
Yes 2.16 (1.11-4.21) 0.02 3.54 (1.07-11.71)
Appetite loss
No 1.00 1.00 0.38
Yes 0.98 (0.52-5.69) 0.97 1.71 (0.52-5.69)
Fatigue
Yes 1.00 1.00 0.44
No 2.04 (1.06-3.93) 0.03 1.70 (0.44-6.54)
Excretion
every day. 1.00 1.00
2-3 times a day 5.46 (1.22-24.52) 0.03 13.02 (0.64-267.16) 0.09
more than 3 days 7.85 (0.93-65.99) 0.06 44.24 (0.79-2455.28) 0.06
Sleeping
Normal 1.00 1.00
Abnormal 1.96 (1.01-3.79) 0.05 2.34 (0.50-10.98) 0.28
Tumor size (cm) (Tumor-related indicators)
< 5 1.00 1.00
≥ 5 0.39 (0.16-0.92) 0.03 1.07 (0.26-4.46) 0.92
AFP (ng/ml)
< 400 1.00 1.00
≥ 400 1.00 (0.99-1.00) 0.06 1.00 (1.00-1.00) < 0.01
† Cox regression