
Page 73 - วารสารการแพทย์แผนไทย ปีที่ 21 ฉบับที่ 2
P. 73
J Thai Trad Alt Med Vol. 21 No. 2 May-Aug 2023 289
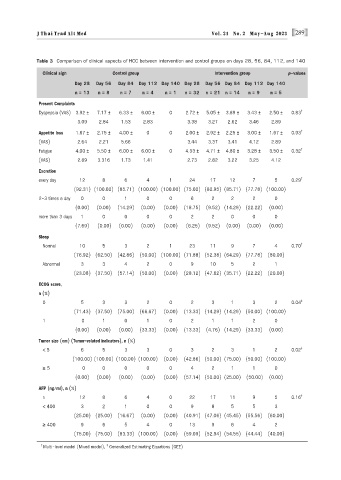
Table 3 Comparison of clinical aspects of HCC between intervention and control groups on days 28, 56, 84, 112, and 140
Clinical sign Control group Intervention group p-values
Day 28 Day 56 Day 84 Day 112 Day 140 Day 28 Day 56 Day 84 Day 112 Day 140
n = 13 n = 8 n = 7 n = 4 n = 1 n = 32 n = 21 n = 14 n = 9 n = 5
Present Complaints
Dyspepsia (VAS) 3.92 ± 7.17 ± 6.33 ± 6.00 ± 0 2.72 ± 5.05 ± 3.89 ± 3.43 ± 2.50 ± 0.83 †
3.09 2.84 1.53 2.83 3.38 3.27 2.62 3.46 2.89
Appetite loss 1.67 ± 2.75 ± 4.00 ± 0 0 2.00 ± 2.92 ± 2.25 ± 3.00 ± 1.67 ± 0.93 †
(VAS) 2.64 2.21 5.66 3.44 3.37 3.41 4.12 2.89
Fatigue 4.00 ± 5.50 ± 6.00 ± 6.00 ± 0 4.33 ± 4.71 ± 4.80 ± 3.28 ± 3.50 ± 0.32 †
(VAS) 2.89 3.316 1.73 1.41 2.73 2.82 3.22 3.25 4.12
Excretion
every day 12 8 6 4 1 24 17 12 7 5 0.29 †
(92.31) (100.00) (85.71) (100.00) (100.00) (75.00) (80.95) (85.71) (77.78) (100.00)
2-3 times a day 0 0 1 0 0 6 2 2 2 0
(0.00) (0.00) (14.29) (0.00) (0.00) (18.75) (9.52) (14.29) (22.22) (0.00)
more than 3 days 1 0 0 0 0 2 2 0 0 0
(7.69) (0.00) (0.00) (0.00) (0.00) (6.25) (9.52) (0.00) (0.00) (0.00)
Sleep
Normal 10 5 3 2 1 23 11 9 7 4 0.70 †
(76.92) (62.50) (42.86) (50.00) (100.00) (71.88) (52.38) (64.29) (77.78) (80.00)
Abnormal 3 3 4 2 0 9 10 5 2 1
(23.08) (37.50) (57.14) (50.00) (0.00) (28.12) (47.62) (35.71) (22.22) (20.00)
ECOG score,
n (%)
0 5 3 3 2 0 2 3 1 3 2 0.04 ‡
(71.43) (37.50) (75.00) (66.67) (0.00) (13.33) (14.29) (14.29) (50.00) (100.00)
1 0 1 0 1 0 2 1 1 2 0
(0.00) (0.00) (0.00) (33.33) (0.00) (13.33) (4.76) (14.29) (33.33) (0.00)
Tumor size (cm) (Tumor-related indicators), n (%)
< 5 6 5 3 3 0 3 2 3 1 2 0.02 ‡
(100.00) (100.00) (100.00) (100.00) (0.00) (42.86) (50.00) (75.00) (50.00) (100.00)
≥ 5 0 0 0 0 0 4 2 1 1 0
(0.00) (0.00) (0.00) (0.00) (0.00) (57.14) (50.00) (25.00) (50.00) (0.00)
AFP (ng/ml), n (%)
n 12 8 6 4 0 22 17 11 9 5 0.16 †
< 400 3 2 1 0 0 9 8 5 5 3
(25.00) (25.00) (16.67) (0.00) (0.00) (40.91) (47.06) (45.45) (55.56) (60.00)
≥ 400 9 6 5 4 0 13 9 6 4 2
(75.00) (75.00) (83.33) (100.00) (0.00) (59.09) (52.94) (54.55) (44.44) (40.00)
‡
†
Multi-level model (Mixed model), Generalized Estimating Equations (GEE)