
Page 54 - วารสารกรมการแพทย์แผนไทยฯ ปีที่ 5 ฉบับที่ 3
P. 54
ÚˆÚ «“√ “√°“√·æ∑¬å·ºπ‰∑¬·≈–°“√·æ∑¬å∑“߇≈◊Õ° ªï∑’Ë ı©∫—∫∑’Ë Û°—𬓬π - ∏—𫓧¡ Úıı
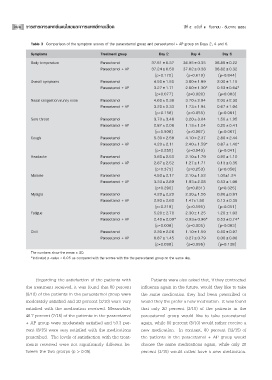
Table 3 Comparison of the symptom scores of the paracetamol group and paracetamol + AP group on Days 2, 4 and 6.
Symptoms Treatment group Day 2 Day 4 Day 6
Body temperature Paracetamol 37.51 ±0.37 36.95 ±0.35 36.85 ±0.22
Paracetamol + AP 37.24 ±0.50 37.02 ±0.38 36.82 ±0.32
(p=0.172) (p=0.619) (p=0.844)
Overall symptoms Paracetamol 4.50 ±1.50 3.60 ±1.89 2.00 ±1.15
Paracetamol + AP 3.27 ±1.71 2.00 ±1.30* 0.53 ±0.64*
(p=0.077) (p=0.020) (p=0.003)
Nasal congestion/runny nose Paracetamol 4.60 ±2.36 3.70 ±2.94 2.00 ±2.30
Paracetamol + AP 3.20 ±2.33 1.73 ±1.94 0.67 ±1.04
(p=0.158) (p=0.055) (p=0.061)
Sore throat Paracetamol 3.70 ±3.46 3.20 ±3.04 1.50 ±1.95
Paracetamol + AP 2.87 ±2.06 1.13 ±1.24 0.20 ±0.41
(p=0.506) (p=0.067) (p=0.067)
Cough Paracetamol 5.30 ±2.58 4.10 ±2.37 2.80 ±2.44
Paracetamol + AP 4.20 ±2.11 2.40 ±1.59* 0.87 ±1.40*
(p=0.255) (p=0.043) (p=0.041)
Headache Paracetamol 3.60 ±2.50 2.10 ±1.79 0.90 ±1.10
Paracetamol + AP 2.67 ±2.52 1.27 ±1.71 0.13 ±0.35
(p=0.373) (p=0.253) (p=0.058)
Malaise Paracetamol 4.50 ±2.17 2.10 ±1.52 1.00±1.24
Paracetamol + AP 3.33 ±2.89 1.93 ±2.08 0.53 ±1.06
(p=0.290) (p=0.831) (p=0.325)
Myalgia Paracetamol 4.20 ±2.20 2.30 ±1.56 0.86 ±0.91
Paracetamol + AP 2.93 ±2.60 1.47±1.50 0.13 ±0.35
(p=0.219) (p=0.195) (p=0.051)
Fatigue Paracetamol 5.20 ±2.70 2.30 ±1.25 1.20 ±1.03
Paracetamol + AP 2.40 ±2.09* 0.93 ±0.96* 0.53 ±0.74*
(p=0.008) (p=0.005) (p=0.003)
Chill Paracetamol 2.30 ±2.26 1.10 ±1.59 0.50 ±0.97
Paracetamol + AP 0.87 ±1.45 0.27 ±0.79 0.00 ±0.00
(p=0.098) (p=0.096) (p=0.138)
The numbers show the mean ± SD.
*indicated p-value < 0.05 as compared with the scores with the the paracetamol group on the same day.
Regarding the satisfaction of the patients with Patients were also asked that, if they contracted
the treatment received, it was found that 80 percent influenza again in the future, would they like to take
(8/10) of the patients in the paracetamol group were the same medication they had been prescribed or
moderately satisfied and 20 percent (2/10) were very would they the prefer a new medication. It was found
satisfied with the medication received. Meanwhile, that only 20 percent (2/10) of the patients in the
46.7 percent (7/15) of the patients in the paracetamol paracetamol group would like to take paracetamol
+ AP group were moderately satisfied and 53.3 per- again, while 80 percent (8/10) would rather receive a
cent (8/15) were very satisfied with the medications new medication. In contrast, 80 percent (12/15) of
prescribed. The levels of satisfaction with the treat- the patients in the paracetamol + AP group would
ments received were not significantly different be- choose the same medications again, while only 20
tween the two groups (p > 0.05). percent (3/15) would rather have a new medication.