Page 53 - วารสารกรมการแพทย์แผนไทยฯ ปีที่ 5 ฉบับที่ 3
P. 53

Journal of Thai Traditional & Alternative Medicine                  Vol. 5 No. 3 September - December 2007 ÚˆÒ


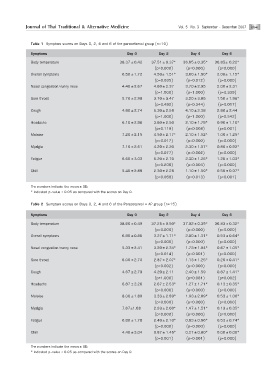
               Table 1 Symptom scores on Days 0, 2, 4 and 6 of the paracetamol group (n=10)

               Symptoms                                   Day 0         Day 2         Day 4          Day 6
               Body temperature                        38.37 ±0.42   37.51 ±0.37*  36.95 ±0.35*  36.85± 0.22*
                                                                      (p=0.000)     (p=0.000)      (p=0.000)
               Overall symptoms                         6.50 ±1.72    4.50± 1.51*   3.60 ±1.90*   2.00± 1.15*
                                                                      (p=0.035)     (p=0.012)      (p=0.000)
               Nasal congestion/runny nose              4.40 ±2.67    4.60 ±2.37    3.70 ±2.95    2.00 ±2.31
                                                                      (p=1.000)     (p=1.000)      (p=0.339)
               Sore throat                              5.70 ±2.98    3.70 ±3.47    3.20 ±3.05    1.50 ±1.96*
                                                                      (p=0.492)     (p=0.344)      (p=0.017)
               Cough                                    4.80 ±2.74    5.30 ±2.58    4.10 ±2.38    2.80 ±2.44
                                                                      (p=1.000)     (p=1.000)      (p=0.542)
               Headache                                 6.10 ±2.96    3.60 ±2.50    2.10 ±1.79*   0.90 ±1.10*
                                                                      (p=0.119)     (p=0.008)      (p=0.001)
               Malaise                                  7.20 ±2.15    4.50 ±2.17*   2.10 ±1.52*   1.00 ±1.25*
                                                                      (p=0.017)     (p=0.000)      (p=0.000)
               Myalgia                                  7.10 ±2.51    4.20 ±2.20    2.30 ±1.57*   0.80 ±0.92*
                                                                      (p=0.077)     (p=0.002)      (p=0.000)
               Fatigue                                  6.60 ±3.03    5.20 ±2.70    2.30 ±1.25*   1.20 ±1.03*
                                                                      (p=0.206)     (p=0.004)      (p=0.000)
               Chill                                    5.40 ±2.88    2.30 ±2.26    1.10 ±1.59*   0.50 ±0.97*
                                                                      (p=0.058)     (p=0.013)      (p=0.001)

               The numbers indicate the mean ± SD.
               * indicated p-value < 0.05 as compared with the scores on Day 0.


               Table 2 Symptom scores on Days 0, 2, 4 and 6 of the Paracetamol + AP group (n=15)

               Symptoms                                   Day 0         Day 2         Day 4          Day 6
               Body temperature                        38.60 ±0.49   37.25 ±0.50*  37.02 ±0.39*  36.83 ±0.32*
                                                                      (p=0.000)     (p=0.000)      (p=0.000)
               Overall symptoms                         6.80 ±0.86    3.27 ±1.71*   2.00 ±1.31*   0.53 ±0.64*
                                                                      (p=0.000)     (p=0.000)      (p=0.000)
               Nasal congestion/runny nose              5.33 ±2.41    3.20 ±2.34*   1.73 ±1.94*   0.67 ±1.05*
                                                                      (p=0.014)     (p=0.001)      (p=0.000)
               Sore throat                              6.00 ±2.70    2.87 ±2.07*   1.13 ±1.25*   0.20 ±0.41*
                                                                      (p=0.002)     (p=0.000)      (p=0.000)
               Cough                                    4.67 ±2.79    4.20 ±2.11    2.40 ±1.59    0.87 ±1.41*
                                                                      (p=1.000)     (p=0.081)      (p=0.002)
               Headache                                 6.87 ±2.26    2.67 ±2.53*   1.27 ±1.71*   0.13 ±0.35*
                                                                      (p=0.000)     (p=0.000)      (p=0.000)
               Malaise                                  8.00 ±1.89    3.33 ±2.89*   1.93 ±2.09*   0.53 ±1.06*
                                                                      (p=0.000)     (p=0.000)      (p=0.000)
               Myalgia                                  7.67±1.68     2.93 ±2.60*   1.47 ±1.51*   0.13 ±0.35*
                                                                      (p=0.000)     (p=0.000)      (p=0.000)
               Fatigue                                  6.80 ±1.78    2.40 ±2.10*   0.93 ±0.96*   0.53 ±0.74*
                                                                      (p=0.000)     (p=0.000)      (p=0.000)
               Chill                                    4.40 ±3.04    0.87 ±1.46*   0.27 ±0.80*   0.00 ±0.00*
                                                                      (p=0.001)     (p=0.001)      (p=0.000)
               The numbers indicate the mean ± SD.
               * indicated p-value < 0.05 as compared with the scores on Day 0.
   48   49   50   51   52   53   54   55   56   57   58