Page 148 - วารสารการแพทย์แผนไทยและการแพทย์ ทางเลือก ปีที่ 19 ฉบับที่ 2 พฤษภาคม-สิงหาคม 2564
P. 148

378 วารสารการแพทย์แผนไทยและการแพทย์ ทางเลือก      ปีที่ 19  ฉบับที่ 2  พฤษภาคม-สิงหาคม 2564


           Table 3  Addiction levels for nicotine dependence before the intervention (Fagerstrom test)

            Nicotine addiction score      Experimental group (n = 43)       Control group (n = 41)
             (total score = 10)                    n (%)                           n (%)
                    0                            3 (6.80)                       13 (31.70)
                    1                            7 (15.90)                       8 (19.50)
                    2                            4 (9.10)                        6 (14.60)
                    3                            5 (11.40)                       2 (4.90)
                    4                           11 (25.00)                       3 (7.30)
                    5                            8 (18.20)                       3 (7.30)
                    6                            0 (0.00)                        4 (9.80)
                    7                            1 (2.30)                        1 (2.40)
                    8                            2 (4.50)                        0 (0.00)
                    9                            2 (4.50)                        0 (0.00)
                    10                           0 (0.00)                        1 (2.40)
                                                   = 3.60,                         = 2.29,
                                                S.D. = 2.31                     S.D. = 2.50


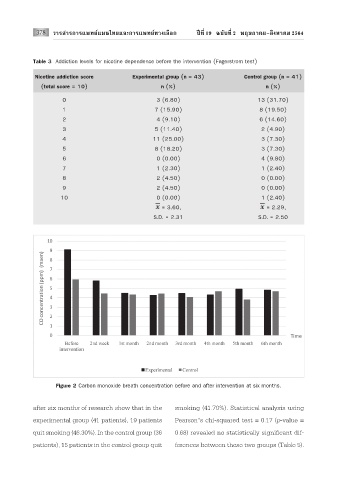
                  Figure 2 Carbon monoxide breath concentration before and after intervention at six months.


           after six months of research show that in the   smoking (41.70%). Statistical analysis using

           experimental group (41 patients), 19 patients   Pearson’s chi-squared test = 0.17 (p-value =
           quit smoking (46.30%). In the control group (36   0.68) revealed no statistically significant dif-
           patients), 15 patients in the control group quit   ferences between these two groups (Table 5).
   143   144   145   146   147   148   149   150   151   152   153