
Page 147 - วารสารการแพทย์แผนไทยและการแพทย์ ทางเลือก ปีที่ 19 ฉบับที่ 2 พฤษภาคม-สิงหาคม 2564
P. 147
J Thai Trad Alt Med Vol. 19 No. 2 May-Aug 2021 377
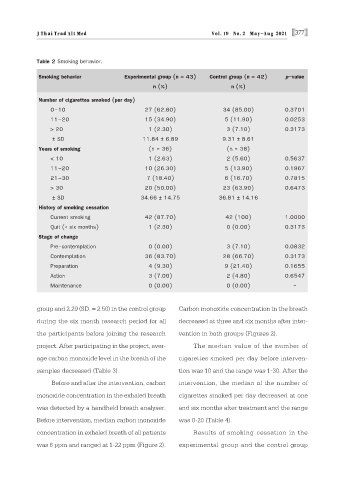
Table 2 Smoking behavior.
Smoking behavior Experimental group (n = 43) Control group (n = 42) p-value
n (%) n (%)
Number of cigarettes smoked (per day)
0–10 27 (62.80) 34 (85.00) 0.3701
11–20 15 (34.90) 5 (11.90) 0.0253
> 20 1 (2.30) 3 (7.10) 0.3173
± SD 11.84 ± 6.89 9.31 ± 8.61
Years of smoking (n = 36) (n = 38)
< 10 1 (2.63) 2 (5.60) 0.5637
11–20 10 (26.30) 5 (13.90) 0.1967
21–30 7 (18.40) 6 (16.70) 0.7815
> 30 20 (50.00) 23 (63.90) 0.6473
± SD 34.66 ± 14.75 36.81 ± 14.16
History of smoking cessation
Current smoking 42 (87.70) 42 (100) 1.0000
Quit (< six months) 1 (2.30) 0 (0.00) 0.3173
Stage of change
Pre-contemplation 0 (0.00) 3 (7.10) 0.0832
Contemplation 36 (83.70) 28 (66.70) 0.3173
Preparation 4 (9.30) 9 (21.40) 0.1655
Action 3 (7.00) 2 (4.80) 0.6547
Maintenance 0 (0.00) 0 (0.00) -
group and 2.29 (SD. = 2.50) in the control group Carbon monoxide concentration in the breath
during the six month research period for all decreased at three and six months after inter-
the participants before joining the research vention in both groups (Figures 2).
project. After participating in the project, aver- The median value of the number of
age carbon monoxide level in the breath of the cigarettes smoked per day before interven-
samples decreased (Table 3). tion was 10 and the range was 1-30. After the
Before and after the intervention, carbon intervention, the median of the number of
monoxide concentration in the exhaled breath cigarettes smoked per day decreased at one
was detected by a handheld breath analyser. and six months after treatment and the range
Before intervention, median carbon monoxide was 0-20 (Table 4).
concentration in exhaled breath of all patients Results of smoking cessation in the
was 6 ppm and ranged at 1-22 ppm (Figure 2). experimental group and the control group