
Page 144 - วารสารการแพทย์แผนไทยและการแพทย์ ทางเลือก ปีที่ 19 ฉบับที่ 2 พฤษภาคม-สิงหาคม 2564
P. 144
374 วารสารการแพทย์แผนไทยและการแพทย์ ทางเลือก ปีที่ 19 ฉบับที่ 2 พฤษภาคม-สิงหาคม 2564
The effects of smoking cessation in patients the success rate of control group was only
with chronic non-communicable diseases 15.2%. The study aim was to induce 50% of
were studied at Pak Nam Lang Suan Hospital. smokers quit smoking with 90% confidence
[4]
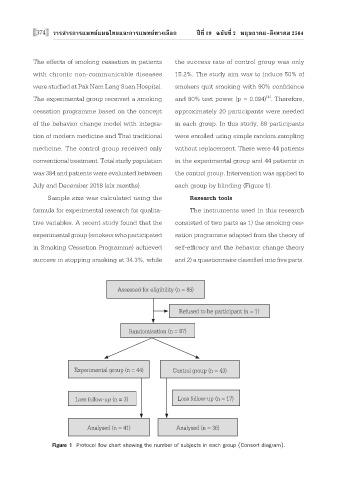
The experimental group received a smoking and 80% test power (p = 0.094) . Therefore,
cessation programme based on the concept approximately 20 participants were needed
of the behavior change model with integra- in each group. In this study, 88 participants
tion of modern medicine and Thai traditional were enrolled using simple random sampling
medicine. The control group received only without replacement. There were 44 patients
conventional treatment. Total study population in the experimental group and 44 patients in
was 384 and patients were evaluated between the control group. Intervention was applied to
July and December 2018 (six months). each group by blinding (Figure 1).
Sample size was calculated using the Research tools
formula for experimental research for qualita- The instruments used in this research
tive variables. A recent study found that the consisted of two parts as 1) the smoking ces-
experimental group (smokers who participated sation programme adapted from the theory of
in Smoking Cessation Programme) achieved self-efficacy and the behavior change theory
success in stopping smoking at 34.3%, while and 2) a questionnaire classified into five parts.
Assessed for eligibility (n = 88)
Refused to be participant (n = 1)
Randomisation (n = 87)
Experimental group (n = 44) Control group (n = 43)
Loss follow-up (n = 3) Loss follow-up (n = 17)
Analysed (n = 41) Analysed (n = 36)
Figure 1 Protocol flow chart showing the number of subjects in each group (Consort diagram).