
Page 102 - วารสารกรมการแพทย์แผนไทยฯ ปีที่ 14 ฉบับที่ 3
P. 102
320
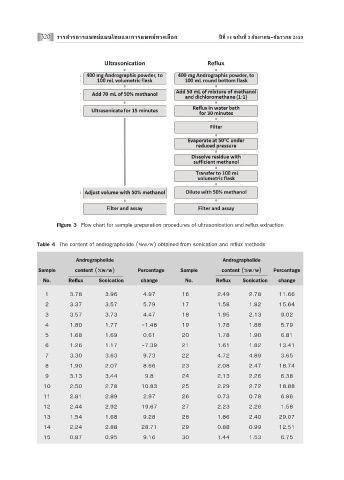
Figure 3 Flow chart for sample preparation procedures of ultrasonication and reflux extraction
Table 4 The content of andrographolide (%w/w) obtained from sonication and reflux methods
Andrographolide Andrographolide
Sample content (%w/w) Percentage Sample content (%w/w) Percentage
No. Reflux Sonication change No. Reflux Sonication change
1 3.78 3.96 4.97 16 2.49 2.78 11.66
2 3.37 3.57 5.79 17 1.58 1.82 15.64
3 3.57 3.73 4.47 18 1.95 2.13 9.02
4 1.80 1.77 -1.48 19 1.78 1.88 5.79
5 1.68 1.69 0.61 20 1.78 1.90 6.81
6 1.26 1.17 -7.39 21 1.61 1.82 13.41
7 3.30 3.63 9.73 22 4.72 4.89 3.65
8 1.90 2.07 8.66 23 2.08 2.47 18.74
9 3.13 3.44 9.8 24 2.13 2.26 6.38
10 2.50 2.78 10.83 25 2.29 2.72 18.88
11 2.81 2.89 2.97 26 0.73 0.78 6.86
12 2.44 2.92 19.67 27 2.23 2.26 1.58
13 1.54 1.68 9.28 28 1.86 2.40 29.07
14 2.24 2.88 28.71 29 0.88 0.99 12.51
15 0.87 0.95 9.16 30 1.44 1.53 6.75